Product film / 01:40 / Published 2026-06-09
Codex for data science
A data-analysis request becomes an interactive report, an editable chart, a visible query source, and a presentation export.
Useful to borrow
Show the report in context, crop to a specific chart interaction, expose provenance, then prove the export by opening it.
Do not infer
The sample business metrics are source-film demo data. Neither the edited pace nor the visible working-time labels establish performance for your product.
Look closer
- Show a control changing the result · 00:38–00:44
18 shot groups.
Read across from the observed content to its treatment and possible adaptation. Enlarge the frame for detail.
Approximate study intervals; horizontal scrolling reveals all columns on small screens.
| Moment / source | Reference frame | What is on screen | Framing / edit | Useful adaptation |
|---|---|---|---|---|
| Shot group 01 ≈ 00:00–00:08 App / browser screenWatch from here ↗ | Sample 00:04.000 | Analysis workspace An empty task window establishes the workspace. | Whole app on a blue desktop. | Use a shorter establishment if narration already supplies context. |
| Shot group 02 ≈ 00:08–00:16 App / browser screenWatch from here ↗ | Sample 00:14.000 | Data-analysis request A request asks for an interactive report using a connected dataset. | Closer composer framing makes the task legible. | Name the input and desired output in the same view. |
| Shot group 03 ≈ 00:16–00:23 App / browser screenWatch from here ↗ | Sample 00:20.000 | Analysis progress The response shows query work and a report summary. | Conversation view then a wider app frame. | Retain provenance-bearing progress, not every waiting state. |
| Shot group 04 ≈ 00:23–00:28 App / browser screenWatch from here ↗ | Sample 00:26.000 | Report summary The report opens beside the conversation with an executive summary. | Split view establishes artifact and origin. | Begin an analytical result with the conclusion viewers need. |
| Shot group 05 ≈ 00:28–00:31 App / browser screenWatch from here ↗ | Sample 00:30.000 | Trend and baseline charts A line chart gives way to a monthly bar comparison. | Vertical report navigation within a stable pane. | Show the comparison that supports the spoken claim. |
| Shot group 06 ≈ 00:31–00:37 App / browser screenWatch from here ↗ | Sample 00:34.000 | Segment analysis The report moves through a segment chart and recommended next steps. | Same document hierarchy connects chart and interpretation. | Keep the evidence next to its qualified conclusion. |
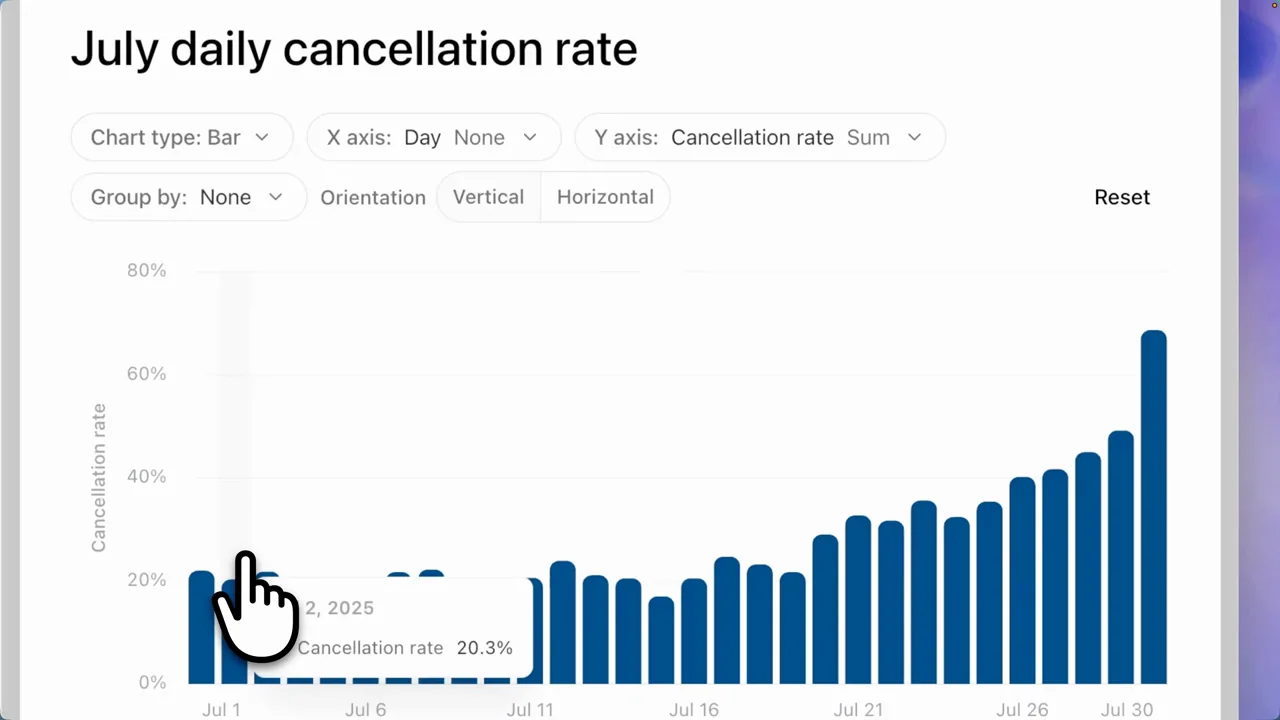
| Shot group 07 ≈ 00:37–00:41 App / browser screenWatch from here ↗ | Sample 00:40.000 | Chart-type control An enlarged chart exposes a type-selection menu. | Tight crop centers the real control. | Make an interactive affordance readable before activating it. |
| Shot group 08 ≈ 00:41–00:48 App / browser screenWatch from here ↗ | Sample 00:44.000 | Interactive bar chart The line becomes bars and a hover tooltip identifies individual values. | Stable chart crop through the changed representation. | Show a state change plus a useful inspection interaction. |
| Shot group 09 ≈ 00:48–00:53 App / browser screenWatch from here ↗ | Sample 00:50.000 | Chart action menu The wider report returns before its chart menu opens. | Re-establishment precedes a contextual action. | Prevent a close-up from losing its place in the report. |
| Shot group 10 ≈ 00:53–00:58 App / browser screenWatch from here ↗ | Sample 00:54.000 | Query provenance A source view displays tables, filters, a query, and a copy control. | Close detail crop favors inspectable evidence. | Expose provenance when accuracy is part of the demo. |
| Shot group 11 ≈ 00:58–01:05 App / browser screenWatch from here ↗ | Sample 01:02.000 | Inline chart-title edit The chart title becomes an editable text field and is revised. | The chart stays visible beneath its editable label. | Demonstrate direct manipulation with a small concrete change. |
| Shot group 12 ≈ 01:05–01:11 App / browser screenWatch from here ↗ | Sample 01:08.000 | Report export menu The export menu offers document and slide destinations. | Crop moves attention to the top-right controls. | Show the destination choice rather than jumping straight to a file. |
| Shot group 13 ≈ 01:11–01:17 App / browser screenWatch from here ↗ | Sample 01:14.000 | Export follow-up dialog A confirmation dialog contains the export request. | Modal preserves the chart behind the action. | Keep an explicit confirmation step in consequential workflows. |
| Shot group 14 ≈ 01:17–01:23 App / browser screenWatch from here ↗ | Sample 01:20.000 | Export task handoff The export request appears in the conversation beside the report. | Return to the split task-and-artifact view. | Connect the export command to its source artifact. |
| Shot group 15 ≈ 01:23–01:28 App / browser screenWatch from here ↗ | Sample 01:26.000 | Slide-deck result A presentation opens with a thumbnail rail and a summary slide. | Whole deck viewer establishes the output format. | Open the exported artifact to prove the handoff worked. |
| Shot group 16 ≈ 01:28–01:32 App / browser screenWatch from here ↗ | Sample 01:30.000 | Chart slides Interior slides show baseline and trend charts. | Matched viewer framing across pages. | Check the analytical content survived the format change. |
| Shot group 17 ≈ 01:32–01:37 App / browser screenWatch from here ↗ | Sample 01:34.000 | Recommendation slide A closing slide gives a short set of next actions. | Held final page in the deck viewer. | End the result on an actionable conclusion. |
| Shot group 18 ≈ 01:37–01:40 Title / identityWatch from here ↗ | Sample 01:38.000 | End identity A white identity ending replaces the deck. | Minimal end card. | Use an original finish while the talking head retains its ending buffer. |