Product film / 01:28 / Published 2026-06-12
Analyze earnings and update your investment thesis with Codex
A research request opens into a long-form analytical report. Alternating overview and close detail makes charts, scenarios, and source limitations the visual subjects.
Useful to borrow
Use a report's hierarchy to structure the demo: conclusion, evidence, scenarios, next actions, and sources. Enlarge dense comparisons selectively.
Do not infer
This is a filmmaking study, not financial guidance or verification of the report's claims. Source-film figures and conclusions must not become all-hands evidence.
Look closer
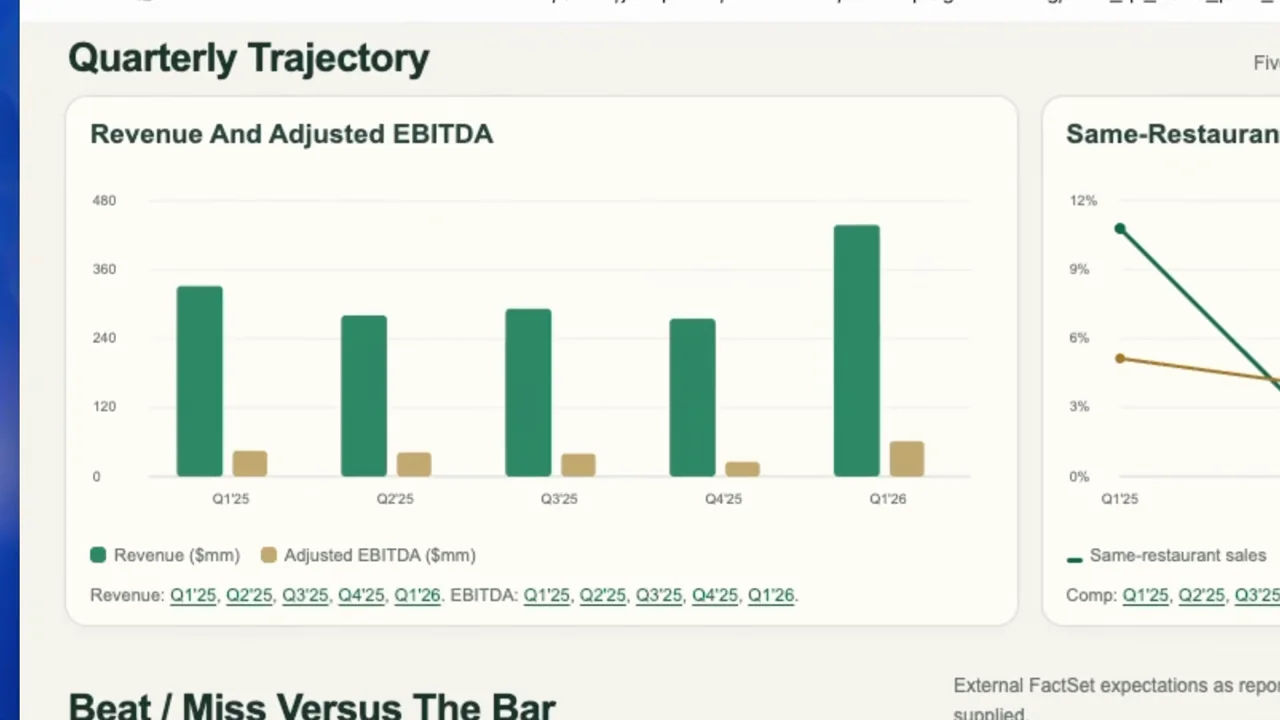
- Move between related details, then stop · 01:05–01:09
16 shot groups.
Read across from the observed content to its treatment and possible adaptation. Enlarge the frame for detail.
Approximate study intervals; horizontal scrolling reveals all columns on small screens.
| Moment / source | Reference frame | What is on screen | Framing / edit | Useful adaptation |
|---|---|---|---|---|
| Shot group 01 ≈ 00:00–00:12 App / browser screenWatch from here ↗ | Sample 00:08.000 | Research workspace An empty app window leads into a new research request. | Whole-window establishment. | Avoid retaining a long empty hold in a narrated presentation. |
| Shot group 02 ≈ 00:12–00:24 App / browser screenWatch from here ↗ | Sample 00:20.000 | Research prompt A detailed earnings-analysis prompt is entered with a selected workflow. | Progressive composer crop. | Frame the constraints that determine the output. |
| Shot group 03 ≈ 00:24–00:35 App / browser screenWatch from here ↗ | Sample 00:30.000 | Research process The response outlines analysis and source-gathering work. | Conversation remains in the established app frame. | Keep process claims tied to visible source or tool activity. |
| Shot group 04 ≈ 00:35–00:41 App / browser screenWatch from here ↗ | Sample 00:38.000 | Source-gathering detail A closer view shows source-related status and tool rows. | Text-focused crop excludes excess window chrome. | Enlarge provenance-bearing details rather than generic progress. |
| Shot group 05 ≈ 00:41–00:46 App / browser screenWatch from here ↗ | Sample 00:44.000 | Report artifact The response returns a linked analytical report. | Wider task view restores context before opening. | Show the saved artifact as the outcome of the request. |
| Shot group 06 ≈ 00:46–00:48 App / browser screenWatch from here ↗ | Sample 00:46.000 | Report cover A green report header opens inside the app browser. | Whole-page result reveal. | Give a complex report a clear title and date context. |
| Shot group 07 ≈ 00:48–00:52 App / browser screenWatch from here ↗ | Sample 00:50.000 | Thesis and decision summary Two summary panels organize the report's conclusion and decision context. | Side-by-side information blocks. | Separate the conclusion from the caveats that qualify it. |
| Shot group 08 ≈ 00:52–00:56 App / browser screenWatch from here ↗ | Sample 00:54.000 | Growth-driver comparison Four explanatory columns appear below the summary. | Stable page width supports comparison. | Use parallel layout for a small set of distinct factors. |
| Shot group 09 ≈ 00:56–00:58 App / browser screenWatch from here ↗ | Sample 00:56.000 | Durability table A structured table compares signals and considerations. | Brief interior report view. | Show an analytical distinction instead of another cover shot. |
| Shot group 10 ≈ 00:58–01:02 App / browser screenWatch from here ↗ | Sample 01:00.000 | Chart and interpretation A line chart sits beside an explanatory panel. | Evidence and interpretation share a row. | Keep the chart's meaning close to the chart. |
| Shot group 11 ≈ 01:02–01:05 App / browser screenWatch from here ↗ | Sample 01:04.000 | Quality-of-results panels Two panels organize the report's result-quality discussion. | Repeated report-card system. | Use consistent containers for successive analytical questions. |
| Shot group 12 ≈ 01:05–01:09 App / browser screenWatch from here ↗ | Sample 01:08.000 | Quarterly charts A closer view moves from revenue bars to a multi-series line chart. | Detail crops travel across the chart row. | Prioritize one chart at a time when labels are dense. |
| Shot group 13 ≈ 01:09–01:15 App / browser screenWatch from here ↗ | Sample 01:12.000 | Scenario comparison Three scenario columns are established and then enlarged. | Wide-to-detail treatment over a fixed report layout. | Keep scenarios visibly distinct from observed results. |
| Shot group 14 ≈ 01:15–01:21 App / browser screenWatch from here ↗ | Sample 01:18.000 | Monitoring checklist A table organizes follow-up checks and decision triggers. | Stable table view after the scenario section. | End analytical content with specific next observations. |
| Shot group 15 ≈ 01:21–01:25 App / browser screenWatch from here ↗ | Sample 01:22.000 | Sources and limitations A source ledger and limitations panel close the report walkthrough. | Two-column evidence and caveat ending. | Do not crop away limitations that matter to the claim. |
| Shot group 16 ≈ 01:25–01:28 Title / identityWatch from here ↗ | Sample 01:28.000 | End identity The report gives way to a white identity ending. | Clean final reset. | Use the presentation's own identity. |