Presenter demo / 02:05 / Published 2026-04-21
Slides & Infographics with ChatGPT Images 2.0
A presenter moves from a detailed prompt to an infographic, then to paper-derived slide and chart examples.
Useful to borrow
Show the complete information design before cropping into a meaningful region.
Do not infer
Generated diagrams and benchmark graphics are not independently verified scientific evidence.
8 shot groups.
Read across from the observed content to its treatment and possible adaptation. Enlarge the frame for detail.
Approximate study intervals; horizontal scrolling reveals all columns on small screens.
| Moment / source | Reference frame | What is on screen | Framing / edit | Useful adaptation |
|---|---|---|---|---|
| Shot group 01 ≈ 00:00–00:18 People / environmentWatch from here ↗ | Sample 00:12.000 | Interview setup Camera equipment and interview angles introduce the speaker. | Production texture before the task. | Use human context sparingly. |
| Shot group 02 ≈ 00:18–00:46 App / browser screenWatch from here ↗ | Sample 00:24.000 | Structured specification Prompt crops expose a formula and detailed layout requirements between interview shots. | Selected text and submit-control detail. | Make demanding requirements legible. |
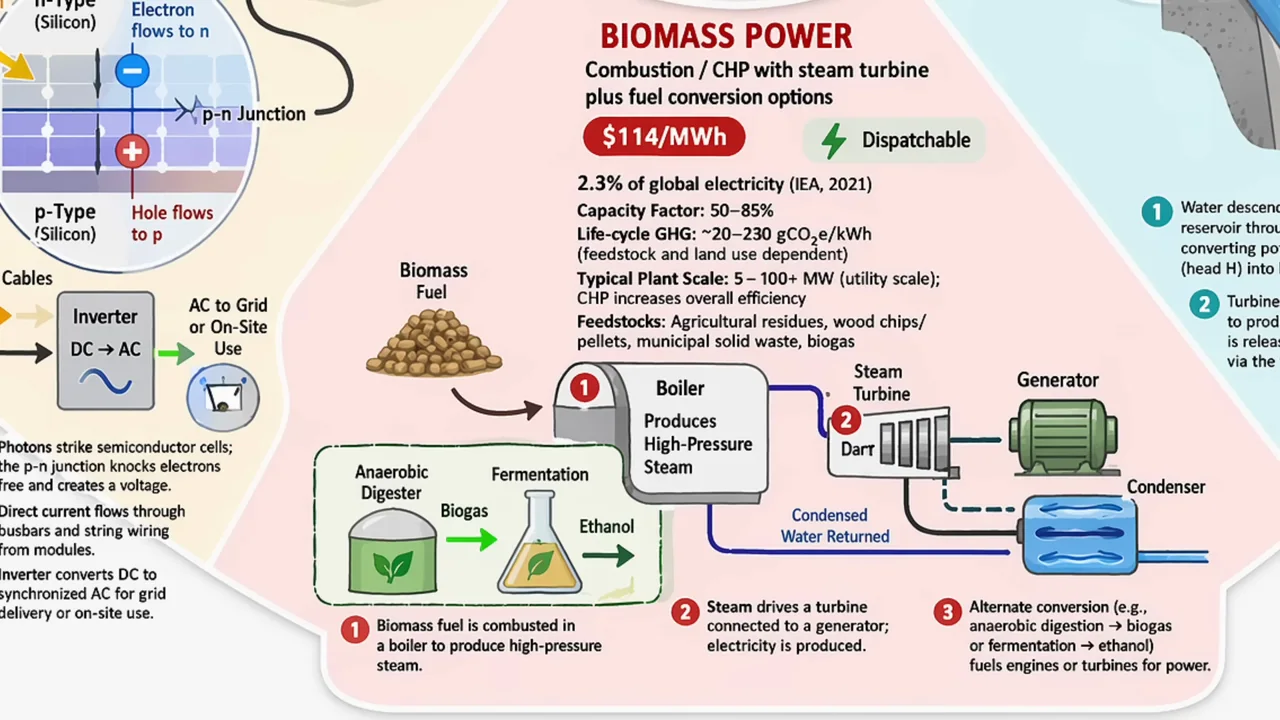
| Shot group 03 ≈ 00:46–00:56 Isolated outputWatch from here ↗ | Sample 00:52.000 | Infographic reveal A full infographic gives way to a colored detail region. | Whole output then crop. | Orient the audience before explaining a diagram. |
| Shot group 04 ≈ 00:56–01:06 App / browser screenWatch from here ↗ | Sample 01:00.000 | Document attachment A source file accompanies a slide-generation request. | Attachment and composer remain visible. | Show the input behind the artifact. |
| Shot group 05 ≈ 01:06–01:22 Isolated outputWatch from here ↗ | Sample 01:12.000 | Slide results Dark slides and a chart close-up alternate with presenter coverage. | Related output sequence. | Keep axes and caveats when cropping charts. |
| Shot group 06 ≈ 01:22–01:50 Isolated outputWatch from here ↗ | Sample 01:40.000 | Further information designs Interview and laptop inserts surround a dense result sheet and printed-style graphic. | Screen-to-output comparison. | Treat generated factual content as needing review. |
| Shot group 07 ≈ 01:50–02:04 People / environmentWatch from here ↗ | Sample 01:56.000 | Closing explanation The presenter finishes in the same room. | Matched interview view. | Return to the speaker after the examples. |
| Shot group 08 ≈ 02:04–02:05 Title / identityWatch from here ↗ | Sample 02:04.000 | End wordmark White identity ending. | Minimal type. | Use an original outro. |